clock
Monday, 29 July 2013
Friday, 12 July 2013
Basics of electronics and fundamentals of physics
here is the link where you find the max information about electronic subject.
https://www.khanacademy.org/science/physics/electricity-and-magnetism
https://www.khanacademy.org/science/physics/electricity-and-magnetism
Thursday, 27 June 2013
K-MAPS SOFTWARE AND INTRODUCTION(karnaughs maps)
Karnaugh Map (K-Map)
A Karnaugh Map is a method of mapping truth tables onto a matrix that identifies places where two or more different combination of the input variables yield the same result. In addition to identifying redundant terms, the K map also cancels them, leaving only the minimized Boolean algebra expressions that will yield the same truth table outputs as the unreduced terms. The best way to understand K maps is to go through an actual simplification process using a K map.
We will start with a three variable truth table. Three variables have 2 to the 3'd, or 8 possible combination of 1’s and0's. This means that the K map must have 8 cells, one for even possible combination of input variables. The input variables can be mapped in any order on the K map, but it must follow the same organization as the truth table being mapped. We will assign the letters R, S, & T to the input variables of our truth table, and X to the output.

The Karnaugh map is laid out so that from cell to cell and from edge to edge, there is only a one bit change in the variables at any given time. This accounts for the column to column and row to row order of 00 01 11 10 (Gray Code). The column variables are assigned across the top of
the map, and the row variables are assigned to the left side of the map. Each cell contains the result of the variables for the binary combination given by the intersecting row and column. If the column variables are R S and the row variables are T U for a 16 cell or four variable map, the combination 0 1 1 0 is the same as (not R S T not U) or cell 6. If the truth table shows a 1 for the output at the position 0 1 1 0, then the Karnaugh map will contain a 1 in that particular cell.

As an example, Let's simplify the 3 bit K map above. Notice the four three variable expressions reduce down to three two variable expressions. This is a substantial savings in circuitry, and the equation will do exactly the same thing as the original unsimplified expression from the truth table.

The same method applies to larger K maps of 4, 5, and 6 variables. Four variable K maps have sixteen cells, since 2 to the 4 is 16. Five variable K maps are mapped as two, sixteen cell maps side by side. It is like mapping one map above the other, with the same numbered cells being redundant. Six variable K maps result in four, sixteen cell maps together in a square pattern. Top to bottom and side by side, redundancies are cancelled in the same numbered cells. More than four variable K maps are rarely used because they are more difficult to follow without getting lost.
A Karnaugh Map is a method of mapping truth tables onto a matrix that identifies places where two or more different combination of the input variables yield the same result. In addition to identifying redundant terms, the K map also cancels them, leaving only the minimized Boolean algebra expressions that will yield the same truth table outputs as the unreduced terms. The best way to understand K maps is to go through an actual simplification process using a K map.
We will start with a three variable truth table. Three variables have 2 to the 3'd, or 8 possible combination of 1’s and0's. This means that the K map must have 8 cells, one for even possible combination of input variables. The input variables can be mapped in any order on the K map, but it must follow the same organization as the truth table being mapped. We will assign the letters R, S, & T to the input variables of our truth table, and X to the output.

The Karnaugh map is laid out so that from cell to cell and from edge to edge, there is only a one bit change in the variables at any given time. This accounts for the column to column and row to row order of 00 01 11 10 (Gray Code). The column variables are assigned across the top of
the map, and the row variables are assigned to the left side of the map. Each cell contains the result of the variables for the binary combination given by the intersecting row and column. If the column variables are R S and the row variables are T U for a 16 cell or four variable map, the combination 0 1 1 0 is the same as (not R S T not U) or cell 6. If the truth table shows a 1 for the output at the position 0 1 1 0, then the Karnaugh map will contain a 1 in that particular cell.

As an example, Let's simplify the 3 bit K map above. Notice the four three variable expressions reduce down to three two variable expressions. This is a substantial savings in circuitry, and the equation will do exactly the same thing as the original unsimplified expression from the truth table.

The same method applies to larger K maps of 4, 5, and 6 variables. Four variable K maps have sixteen cells, since 2 to the 4 is 16. Five variable K maps are mapped as two, sixteen cell maps side by side. It is like mapping one map above the other, with the same numbered cells being redundant. Six variable K maps result in four, sixteen cell maps together in a square pattern. Top to bottom and side by side, redundancies are cancelled in the same numbered cells. More than four variable K maps are rarely used because they are more difficult to follow without getting lost.
Software to evaluate K-Map
This is a software to minimize a k-map using graphical interface and it can solve k-maps from 3-8 variables.

Click for better Quality...
This is a software to minimize a k-map using graphical interface and it can solve k-maps from 3-8 variables.

Click for better Quality...
CLICK HERE TO DOWNLOAD http://downloads.ziddu.com/downloadfile/5920489/minimalization.exe.html
Monday, 24 June 2013
LEAD ACID BATTERY INFORMATION
How are they made and how do they
work ?
The lead acid battery is made up of a series of identical cells
each containing sets of positive and negative plates.
In semi traction cells flat plate construction is used. Each
positive plate is a cast metallic frame which contains the lead dioxide active
material. The negative plates contain spongy lead active material. also on a
similar frame. Both plates usually have the same surface areas.
In practice a typical cell is constructed with many more plates
than just two in order to get the required current output. All positive plates
are connected together as are all the negatives. Because each positive plate is
always positioned between two negative plates, there is always one or more
negative plate than positives.
The resultant voltage of lead acid cell is normally 2 volts In
order to achieve the voltage required for the application each cell is then
connected in series by substantial metal straps to form a battery. In a typical
monoblock battery, such as that used in a car for starting, the voltage
required is 12 volts, achieved by connecting six cells together in series and
enclosing them in one plastic box. Leisure batteries where a sustained current
requirement is needed and a deep cycle, the ability to be discharged to 90%,
have a different make-up to that of a traction battery that is used in a car.
The cell containing the plates is filled with an electrolyte
made up of sulphuric acid and distilled water with a specific gravity of 1.270
at 60deg F (15.6deg C). Sulphuric acid is a very active compound of hydrogen
and sulphur and oxygen atoms. Sulphuric acid is a very reactive substance and
because of its instability it is able to distribute itself very evenly
throughout the electrolyte in the battery. Over time, this action ensures that
an even reaction can occur between all the plates. producing voltage and
current. The chemical reaction between constituent parts of the electrolyte and
the 1. spongy lead of the negative plates and 2. the lead dioxide at the positive
plates turns the surface of both plates into lead sulphate. As this process
occurs the hydrogen within the acid reacts with the oxygen within the lead
dioxide to form water. The net result of all this reaction is that the positive
plate gives up electrons and the negative plate gains them in equal numbers,
thereby creating a potential difference between the two plates. The duration of
the reactions producing the cell voltage is limited if there is no connection
between the two plates and the voltage will remain constant.
If a connection (a load) is placed between the positive and
negative plates the chemical reaction is able to continue with electrons
flowing through the circuit from the negative plate to the positive. The flow
of electrons is in fact the current produced by the cell. Only when the supply
of electrons becomes depleted i.e. when the active material on the negative
plate has been used up, and the within the electrolyte has mostly been turned
into water will the battery fail to produce any current. During the chemical
process different levels of heating can occur and the faster a battery is
exhausted the greater will be the heating and thus the efficiency of the system
will be reduced.
Care and Maintenance of Flooded Lead
Acid Batteries
The most important aspects of care
for these and all other types of batteries concern both charge and discharge as
well as the mechanical treatment of the batteries i.e. keeping them topped up
with water etc.
It is important to consider that
lead acid (pb) batteries are, as we have seen above, quite delicate chemical
factories.
Discharge
Lead acid batteries should never be
run flat. The maximum recommended discharge is 75% of the total. This means
that the battery should have a minimum of 25% of charge remaining when it is
put on charge.
Lead acid batteries once filled with
electrolyte, should always be regularly charged even if they are not in use.
When left idle a filled battery will self discharge because of its own internal
resistance. left long enough a battery can go completely flat without ever
having been put into service. Storage also affects the rate of discharge. A
battery should never be stored directly on the ground and especially not on
concrete. The best storage method is wooden pallets which do not conduct or
allow damp paths and do allow good air circulation. During storage, most
manufacturers recommend a freshening charge once every two months or so.
How to find the state of charge
It is extremely difficult to
accurately measure the state of charge of a lead acid battery and to predict
the remaining capacity.
To determine the SOC (State Of
Charge) of a lead acid battery, the classic voltmeter approach does not work
well. The terminal voltage will vary widely between batteries as a function of
things like ambient temperature and the
relative age of the battery. A full set of temperature profile tables would show big differences in the open circuit terminal voltage over a wide temperature range. This is why a good charger must incorporate a temperature
compensation network to avoid ‘over’ or ‘under’ charging the battery at different ambient temperatures. To test a lead acid battery’s SOC, the best indicator is a hydrometer. When you test a battery’s SOC with a hydrometer, you are actually measuring the amount of sulfuric acid left in the electrolyte solution. As more energy is drained from the battery, the ratio of sulfuric acid to water decreases and the created lead sulfate byproduct begins forming on the
electrode plates. A low hydrometer reading means the chemical makeup that generates the free electrons is diminished so not as much energy is stored for use.
The term ‘specific gravity’ is often used to benchmark a lead acid battery’s SOC. The specific gravity of a substance is a comparison of its density to that of water (1.000). Imagine a one gallon bottle filled with water and a second
filled with feathers. There are equal volumes of material present in both but the bottle with the feathers will weigh less than that containing the water. The resultant specific gravity value of the bottle of feathers would be less than that of the bottle of water. With lead acid batteries, the sulfur atoms break down and leach out of the electrolyte solution as it discharges. The breakdown of the electrolyte reduces its overall ‘weight’ as the sulfur is removed from the solution thus reducing the specific gravity measurement. Take a look at the table below:
|
State
of Charge as related to Specific
Gravity and Open-Circuit Voltage |
||
|
State
Of Charge
|
Specific
Gravity (sg)
|
Open-Circuit
Voltage (approximate) |
|
100%
|
1.265
|
12.63
|
|
75%
|
1.210
|
12.30
|
|
50%
|
1.160
|
12.00
|
|
25%
|
1.120
|
11.76
|
|
0%
|
1.100
|
11.64
|
Great care should be taken to avoid
discharging a battery beyond the 75% SOC point. Once the specific gravity drops
below the 1.210 level, excessive sulfate deposits form on the electrode plates.
This process is called ‘sulfation’ and leads to the hardening of the electrode
plates. If the battery is kept in a low charge state for long a period of time,
the sulfation process will eventually reduce the ability of the battery to
generate ion charge carries to the point that it no longer provides the needed
power. This point is otherwise known as a DEAD BATTERY!
When you recharge the battery, the process is reversed and the sulfur returns to the electrolyte solution. Proper cycling of the battery will ensure a long and functional life. If the battery is abused by allowing sulfation of the electrode plates on a regular basis or over an extended period of time, the charging process will not be able to restore the battery to its former full potential. Time to make a costly battery replacement!
When you recharge the battery, the process is reversed and the sulfur returns to the electrolyte solution. Proper cycling of the battery will ensure a long and functional life. If the battery is abused by allowing sulfation of the electrode plates on a regular basis or over an extended period of time, the charging process will not be able to restore the battery to its former full potential. Time to make a costly battery replacement!
Sulfation is mainly due to
undercharging. Here the sulfate ions have entered into deep bonds with the lead
on the cell's plates. The sulfate ions can bond with the lead at three
successively deeper energy levels. Level One is the bond we use when we
normally charge and discharge the cell. After a month or so at Level One, some
of the bonds form Level Two bonds which require more electric power to break.
After several months of being at Level Two bond, the sulfate ions really cozy
up to the lead and form Level Three bonds. Level Three bonds are not accessible
electrically. No amount of recharging will break Level Three bonds. The longer
the lead sulfate bond stays at a level the more likely it is to form a closer
acquaintance and enter the next deeper level. This is why it is so important to
fully, regularly, and completely, recharge lead-acid cells.
Equalization Charges
If the loss in capacity is due to Level Two bonding, then a repeated series of equalizing charges will break the Level Two bonds. Under equalization the Level Two bonds will first be transformed into Level One bonds, and then the sulfate ion can be kicked loose of the lead entirely and reenter the electrolyte solution. If your lead-acid cells have lost capacity, then a regime of equalizing charges is the first procedure to try. An equalization charge is a controlled overcharge of an already fully recharged cell. First recharge the cell and then continue to charge the cell at a C/20 rate for five to seven hours. During equalization charges, the cell voltage will become very high, about 2.7 VDC per cell. This overcharge contains the necessary power to break the Level Two bonds and force them to Level One. Once they reach Level One, the bond is easily broken and the sulfate ions reenter into solution in the electrolyte.
If the loss in capacity is due to Level Two bonding, then a repeated series of equalizing charges will break the Level Two bonds. Under equalization the Level Two bonds will first be transformed into Level One bonds, and then the sulfate ion can be kicked loose of the lead entirely and reenter the electrolyte solution. If your lead-acid cells have lost capacity, then a regime of equalizing charges is the first procedure to try. An equalization charge is a controlled overcharge of an already fully recharged cell. First recharge the cell and then continue to charge the cell at a C/20 rate for five to seven hours. During equalization charges, the cell voltage will become very high, about 2.7 VDC per cell. This overcharge contains the necessary power to break the Level Two bonds and force them to Level One. Once they reach Level One, the bond is easily broken and the sulfate ions reenter into solution in the electrolyte.
Battery capacity is not comparable
to a tank full of petrol. A filled petrol tank contains a finite amount of
energy which can be used either slowly or fast according to the energy
required. Battery capacity is not so simple.
In a battery, the rate of which
energy is drawn affects the overall amount of energy available from the
battery. For example , a 100 Ah battery rated at 20 hour rate means that over
20 hours there are 100 Ah available, or to put it another way you can expect to
draw up to 5 Amps per hour for up to 20 hours, 20x5=100Ah.
If you try to draw the battery down
more quickly you cannot expect to get the same amount of Ah from it. For
example if you draw it down over just one hour the approximate capacity will
become 100 x 0.59 which =59Ah. Putting this another way means that you can
connect a load on the battery which will draw 59 Amps for just one hour. If you
discharge over just half an hour you can only expect to get around half (47%)
the capacity from your batteries.
With most uses the rate at which a
battery is discharged varies enormously , you can see that any battery
condition indicator has to be quite a clever piece of equipment if it is ever
going to get close to giving an accurate reading.
Charging Lead Acid Batteries
Battery vent caps should always be
kept in place and tight during both charging and discharging.
For best battery life, i.e. greatest
number of charge/discharge cycles and years service most battery manufacturers
recommend that you should aim to recharge the batteries when they have reached
around 50% discharge. This level of discharge, of course, must be measured
according to the rate at which the battery is discharged, which as we have
already seen, varies the available total capacity of the battery.
In addition, some battery
manufacturers specify that best life will be achieved only if the batteries are
discharged sufficiently for a 4 hour bulk charge to take place before the
batteries are fully recharged.
A reasonable rule of thumb is that
you should aim to charge the batteries only when they are between 70% and 40%
discharged. If you charge them then they are only lightly discharged i.e. less
than 40% you will end up boiling them unnecessarily which wastes energy in the
form of heat and gassed off hydrogen and in turn shortens the life of the batteries.
In effect the batteries are being overcharged which can cause degradation and
buckling of the plates. In the process some active material is forced off the
plates and drops down to the bottom of the battery. If this occurs frequently
the eventual result is a build up of a bridge between the plates which in turn
can cause a possible short across the plates. This situation leads to the
destruction of a cell which then reduces the capacity of the battery.
To confuse matters further, a
battery will operate at its most efficient the deeper it is discharged, up to
around 75%. The bulk phase of the charge cycle is the most efficient and is
proportionately longer the deeper the discharge.
There are many battery chargers
available. Today, manufacturers supply automatic chargers which are supposed to
ensure optimum battery life. there are numerous charge profiles available and
now, with the advent of the electronic switch mode chargers, it is possible to
have a fully programmable charger on board your car capable of charging almost
any type of battery.
Lead acid batteries must be charged
carefully. If the charge is too violent and uncontrolled the batteries can
overheat and cause thermal run-away which can result in a possible explosion.
Too gently charging will take too
long to get the batteries fully charged with the result that the batteries will
end up being used in an under charged state eventually leading to premature
failure due to sulphation.
The latest electronic chargers
mostly make us the IUI charge profile for standard flooded lead acid batteries.
This means that the current drawn by the batteries is allowed to flow at a
constant (I) rate while the voltage is allowed to rise of its own accord, which
it will do as the battery starts to be charged up. This first part of the
charging cycle is known as the bulk charge phase. When a preset voltage has
been reached, normally the voltage at which the batteries just start to gas,
the charger will switch into the constant voltage (U) phase and the current
drawn by the battery will gradually drop until it hits another preset level.
This second part of the cycle is really the finish charge where the battery
just topped up to the brim very carefully at a much gently diminishing rate.
Finally the charger will switch again into the constant current mode (I) and
the voltage is allowed to rise again, up to a new higher preset limit, in order
to achieve a successful equalization charge.
The Bulk Charge
In this first part of the charge the
battery is allowed to have a large draw on the available current. Usually the
limit to this current level is determined by the availability of a suitably
sized mains outlet, especially on large batteries. It is however, worth noting
that that the life of a battery will be greatest if even this first bulk phase
of charging is started off gently and the maximum current is limited. If the
current is too high the result will be excess heating within the battery which
is wasteful and could lead to buckling of the plates and destruction of the
battery. Sizing of the charger to suit the batteries is important.
Finish charge
Once the bulk phase has been
completed, the finish phase commences and the battery charge is topped off.
This phase is very important. If the battery is not topped up gently it will
overflow in the form of waste heat and violent gassing of the plates which
again can lead to the plates buckling and the battery being destroyed. If the
battery is not topped up fully, it will become sulphated after only a few charges
and the result will be premature failure.
Equalization
In any cyclic application, a series
of batteries will always need to be equalized from time to time in order to
ensure that the battery cells remain at the same voltage throughout the pack.
No two battery cells or batteries
are created equal. During both charge and discharge each and every cell/battery
will react in a minutely different way to its neighbour. This could mean that
each battery may be holding a different quantity of charge. In order to get the
most out of the total battery pack it is necessary to make sure, as far as
possible, that each and every battery is holding a similar amount of charge.
During the charge cycle the voltages
of the different batteries will very. In order to bring them all to the same
level it is necessary to give some a slight overcharge in order to bring the
other up to full charge.
Equalization is done by allowing the
voltage to rise while allowing a small constant current to the batteries. The
voltage is allowed to rise above the normal finish voltage in order to allow
the weaker batteries/cells to draw more current. The stronger batteries will
not be adversely affected providing the current is gently and the period and
frequency of overcharging are not too high and great respectively. The stronger
batteries will absorb the overcharge by giving off heat by gently boiling and
gassing more heavily. Once the weaker batteries have absorbed the required
current, the equalization charge can be halted. The equalization time should be
long enough to bring all the batteries up to a full state of charge. As the
time factor will very the most reliable way to check the charge states is by a
voltmeter on each cell or individual battery.
Really sophisticated battery
charging and monitoring systems do not require the use of an equalization
charge and are able to charge all the batteries fully including the weaker ones
without overcharging the strong ones.
In these systems, each battery is
fitted with an electronic clamp, which gradually reduces the amount of charge
going into the fully charged batteries as the finish charge progresses. This
means that the weaker batteries receive more current to bring them up to a full
state of charge and the strong batteries are prevented from being overcharged
unnecessarily. The drawback with these sophisticated systems is their cost. The
price of each battery clamp can be in the order of 1/5 the cost of each
battery.
Watering
Traction and semi traction batteries are generally supplied
with removable vent caps so that they can be kept topped up with water. The
action of charging the batteries causes gassing when a certain voltage is
reached, usually somewhere around 2.35 to 2.4 volts per cell. The result is
that water is depleted of its constituent parts by liberation of the Hydrogen
gas plates. Hydrogen is of course much less dense that air and the electrolyte
and consequently floats out of the batteries at the earliest opportunity. This
water must therefore be replenished from time to time. If you do not gas a
battery the chances are that it will become sulphated due to fact that not all
the sulphate will be fully removed during the non gassing phase of charging.
It is very important to note that only very pure water is
suitable for topping up. It must contain no mineral traces and especially no
metallic solids, especially iron. The most suitable form of water is distilled
water or water that has been chemically treated and demineralised. Only these
types of water should ever be used to top up the batteries. Tap water will
quickly corrode the battery and should never be used. The frequency of topping
up required for the batteries depends on how they are used. If the are
frequently and heavily discharged they will need to be topped up regularly.
Perhaps every two weeks to a month.
If the batteries are not charged and discharged frequently then
it is likely that they will not require topping up for longer periods of time,
say once every two or three months or so.
If the batteries are regularly charged after only short
discharges they will use much more water than normally. This type of treatment
of the batteries should be avoided. It is most important to make sure that the
tops of the plates in a battery never become exposed. They should always be
covered by electrolyte or they will quickly sulphate and the battery will fail.
If watering is too much of a chore, It is possible to fit either automatic
watering systems or catalytic caps. With the former, the battery vent caps are
replaced with special caps, which incorporate float valves.
A series of hoses connect the float caps to a single filling
point. The filling point can be arranged so that distilled water is
poured into it from time to time or a reservoir can be fitted to constantly top
up the batteries. The catalyst caps prevent the battery charging gases from
venting to atmosphere and by chemical action combine the gases back into water.
Thus there is little or no water loss. Both the above systems work but there
are drawbacks. Lots of hoses interconnecting battery cells and batteries can
pose a serious safety threat if one of the cells goes into thermal run-away and
the vent caps block and the tubes have no water in them. The result is that
ignition from one cell will almost instantaneously result in ignition in all
the rest of the cells as the tubes will fill very quickly with hydrogen gas
which is extremely combustible and explosive, i.e. like the H bomb! A study by
Lucas back in the 1970s showed what can happen. In a demonstration, two
batteries were connected via their vent float caps by a 3-mm bore tube of a
length of over 60-ft. Combustion was artificially initiated in one battery and
within an almost immeasurably short time combustion occurred in the second
battery. The moral of this tale is that only vent float caps in first class
condition should be used and at around £5-00 to £8-00 each they are not cheap!
In addition, should the tubes ever become blocked or the floats fail to operate
correctly, it is highly likely that the batteries will not receive the correct
supply of water and the result will be failure of at least one cell.
The catalyst caps are possibly a better bet. They are however,
even more expensive and do not last for ever. Most sealed batteries make use of
a built in catalyst system.
The cheapest method of watering is by hand. It is also the most
reliable provided it is done regularly.
Temperature
Temperature affects charging as well as discharge. As a rough
rule of thumb, the cooler the temperature the more charge a battery will absorb
and the warmer the temperature the more it will discharge. There are of course
limits. However it is senseless to charge a battery that has just been
discharged fast and has been left out in the sun. In these circumstances it
must be allowed to cool before charging is initiated. The ideal charging
temperature varies but a reasonable guide is between 15 and 25 degrees
Centigrade. Ideal discharge temperatures are between 20 and 30 degrees
centigrade. Unfortunately discharging a battery at a higher temperature, while
desirably affecting its performance, will adversely affect its life. In fact,
so far as I can determine almost every battery manufacturer can work out the
number of Ah which can be drawn from any battery over its life under given
constant discharge conditions. There does appear to be a finite number of Ah
that can be drawn from a battery for a given discharge profile. Predicting this
discharge profile is the difficult bit!
Teardown of the mysterious KMS 4-port USB charger
Teardown of the mysterious KMS 4-port USB charger
In this article I tear down a 4-port USB charger of puzzling origin.
This charger is a huge step above the $2 counterfeit chargers I examined earlier
in design and manufacture, but considerably below the quality of
name-brand chargers. Likewise with safety - the charger was built with
some attention to safety, but appears to fall short of UL standards.
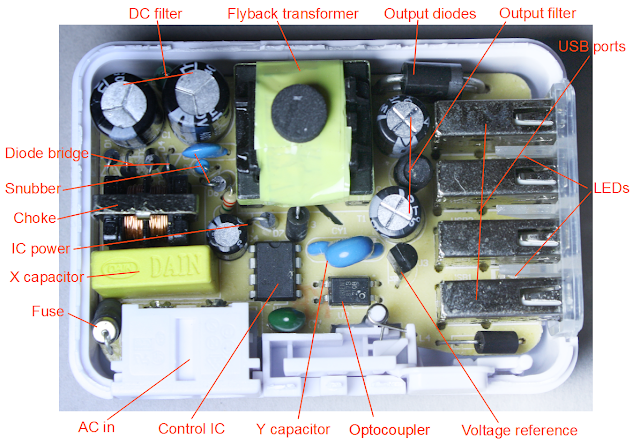
One puzzle about this charger is it's unclear who makes it and what model it is. The case says it's the KMS AC-09 but the circuit board says "TC09-new-V4.2". Amazon lists the brand as "Cosmos®", but I couldn't find any sign that KMS or Cosmos are actual companies. After some web searches, I think the charger is built by Guangzhou Panyu Qiaonan Saidi Electronic Factory (more) as the TC09 charger for $5.30 wholesale, or maybe HK Yingjia International, a consumer electronics manufacturer in Shenzhen (more). In any case, I'll call this the "KMS charger" since I need to call it something.
In my previous lab analysis of 12 chargers, I compared a dozen different chargers in 9 different categories, rating them from 1 to 5 'bolts' and the KMS charger came in about average in terms of performance. The results for the KMS charger are summarized below. For details on these measurements, see my previous article A dozen USB chargers in the lab).
The charger looks mostly safe, although it doesn't have UL certification and I suspect it would fail certification. The 6mm clearance between the primary and secondary looks solid. However, the transformer windings are only separated by 3mm, rather than 6mm, as I show below. (This is still much superior to the $2 chargers that have almost no separation.)
One interesting feature of the power supply is the power plug can be interchanged for use in different countries. (Some other chargers such as the HP TouchPad and Apple iPad are similar.)

The charger has some quality issues. The power quality measurements I did in my previous article show the KMS charger has fairly poor quality output, with a lot of noise in the output.
The IC datasheet recommends 200 mm2 of foil on the IC output pins to provide cooling. I measured about 18 mm2 (less than 10% of recommended), which suggests the charger may overheat under full load.
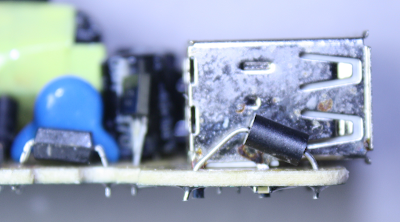
The above photo shows that the build quality of the charger is not extremely high. The inductor at the front right is very crooked, and the optocoupler at the left is somewhat crooked. While this doesn't affect the performance, it shows the assembly was rapid rather than careful. More concerning, some of the solder joints appear to be almost bridged, which could cause catastrophic failure of the charger. I also found a government report of a KMS charger catching fire, apparently due to a loose wire in the power plug.
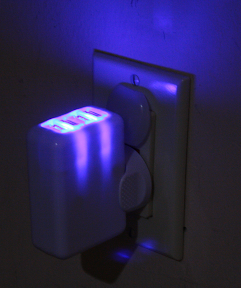
One unique feature of the charger is the blue LEDs which cause it to emit an eerie blue glow when in use. A lot of users dislike this though (according to reviews), because the light is distracting at night.
 For readers interested in circuits, I have prepared the above
approximate schematic (click for a larger view). The circuit is pretty
straightforward compared to other chargers (look at my iPhone charger schematic
for comparison). Starting at the upper left, the input AC is converted
to DC by the diode bridge, and then filtered by a simple
inductor-capacitor filter. This high-voltage DC is connected to the
flyback transformer primary. The THX203H control IC switches the other
side of the flyback transformer to ground through the current-sense
resistors R12A and R12B and inductor L3. (Most chargers use a separate
switching transistor, but in this charger, the transistor is inside the
control IC.) The snubber circuit R2, C3, and D6 absorbs some of the
high-frequency switching spikes (although looking at the output below,
this circuit isn't entirely successful). The auxiliary transformer
winding and D7 and C4 provide the DC power to the control IC. The
optocoupler provides feedback to the IC, indicating the output voltage
level.
On the secondary side, the high-speed Schottky diodes (D5) convert the transformer output to DC. This is then filtered through an inductor-capacitor filter that smooths it out. The output voltage feedback is generated by the TL431A regulator and fed into the optocoupler.[1]
Finally, the actual USB output circuitry has more components than you'd expect. For each pair of ports, four resistors set the D+ and D- voltages to indicate to devices that the charger is (pretending to be) an Apple 2A charger. Each port has a small bypass capacitor to smooth out power transients. Finally there are two blue LEDs with current-limiting resistors to provide the blue glow.
The controller IC poses a bit of a mystery. It's labeled as the THX 203H controller, which turns out to be manufactured by NanJing TongHuaXin Electronic Co, Ltd., a Chinese switching power supply chip company (details). The datasheet for this part is very hard to understand, as it is machine-translated from Chinese, for example:
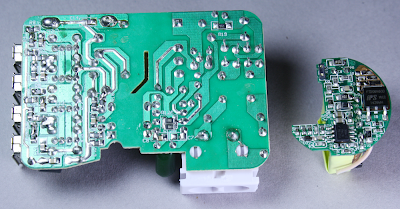 The above picture shows the KMS charger circuit board on the left and a
circuit board from the HP TouchPad charger on the right.
Compact phone chargers such as the iPhone or TouchPad chargers go to
amazing effort to pack the components as tightly as possible. The KMS
charger on the other hand has a much more spacious design with a lot of
wasted space. Since any charger with 4 USB ports is going to be fairly
large, they probably figured it's not worth the effort to make the rest
of the circuitry compact. The difference in density between the two
circuit boards is striking, though.
A key safety feature of the KMS charger is visible in the middle of the circuit board - note the angular cut-out slot, and the empty vertical region with no circuitry. This isolates the high-voltage circuits on the right from the low-voltage output circuits on the left. The KMS charger has a safe 6mm gap and the cut-out provides additional creepage distance. Counterfeit chargers usually skip this critical safety feature, with only a millimeter or two keeping the high voltage from reaching the output and shocking the user.
You might wonder how the charger works if the high voltage and low voltage circuits are separated by a gap. The key is that any components that cross this gap must be specially designed to avoid electrical hazards. The key component is the flyback transformer, which transfers the power through magnetic fields, avoiding any direct electrical connection between the two sides. The feedback signal passes from the secondary to the primary through an optocoupler, which transmits the feedback through a light signal, again avoiding an electrical connection. Finally, a Y safety capacitor connects the primary and secondary grounds to reduce electrical noise. The design of a Y capacitor ensures it won't pass dangerous electrical currents, and won't short out even under fault conditions.

Under the first layers of insulating tape is a copper 'belly band' which surrounds the transformer to provide noise shielding from eddy currents in the transformer.[2] This copper shielding is omitted from super-cheap transformers, showing that this charger goes beyond the minimum.
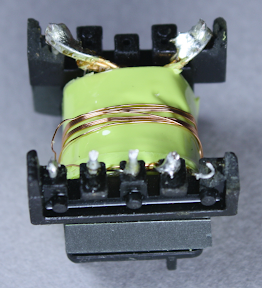
The windings are all separated by insulating tape. Under the belly band and insulating tape is the auxiliary winding, which provides power to the control IC. You might wonder why the IC needs a separate power supply instead of using the USB power output, but this wouldn't be safe because the USB output would no longer be isolated from the input. This winding is 9 turns of wire; since the IC requires low current, the wire is fairly thin.
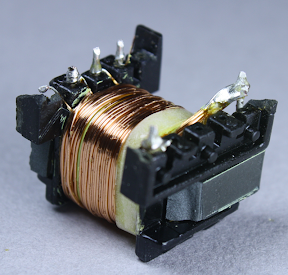
Above you can see half of the primary winding, which is fed by the input power. This winding has 40 turns of wire.
An interesting safety feature is the 3 mm "margin tape"[3] to the lower right of the winding, which ensures that the primary winding stays 3 mm away from the edge. I was interested to see this, since other transformers I've disassembled use triple-insulated wire instead of boundary tape. To ensure safe electrical isolation between the primary and secondary windings, either the secondary wires need to be triple-insulated, or there needs to be at least 6mm of distance between the windings. Super-small chargers don't have 3mm of extra room, so they use the more expensive triple-insulated wire. But since the KMS is larger, it uses the 3mm margin tape. I'm not an expert on safety requirements, but it looks like this transformer doesn't quite meet the requirements. Normally, the margin tape is put on both sides, so there's a total of 6mm creepage distance between the windings.[4][5] But since the tape is only on one side, the windings only have half of the required distance.
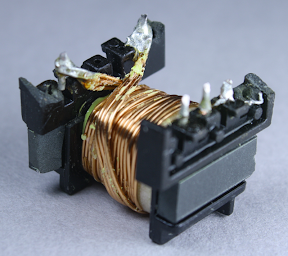
The secondary winding provides the low-voltage high-current output with 8 turns of wire. In order to support 2 amps, this winding has thick wire with four strands in parallel. I haven't seen parallel strands like this before, probably because the KMS charger supplies higher power. Note the 3mm margin tape keeping the winding away from the edge.

Finally, the second half of the primary winding forms the innermost layer of the transformer; this is also 40 turns of wire. The primary winding is split into two layers that surround the secondary winding for better electrical properties. Note that the primary winding is 80 turns, while the secondary output winding is 8 turns. To oversimplify a bit, this means the output will be 10 times the current of the input at 1/10 the voltage, which is how the high voltage low current input results in the low voltage high current output. The above picture gives a good view of the 3mm margin tape at the right that keeps the wire away from the edge of the core.
By looking at the output voltage and frequency spectrum, we can determine a fair bit about how the device operates. I measured a constant 60 kHz switching frequency above 1 amp output load, but a dropping frequency for lower loads. The datasheet gives some clues to this behavior. The power supply normally operates using PWM (pulse width modulation). The switching frequency is constant, but the amount of time the power transistor is on varies. The longer it is on, the more power into the transformer and the more output power. This matches the observed behavior from 1 amp to 3.5 amps. The datasheet also describes how the switching frequency drops under low power, which matches what I observed below 1 amp.
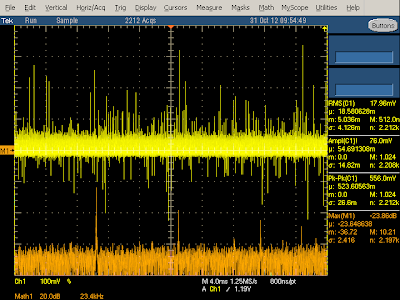
The above oscilloscope trace illustrates the behavior when producing 2 amps. The frequency spectrum shows narrow peaks (orange) at the 60 kHz switching frequency and harmonics. The yellow output voltage shows a bunch of large spikes due to the power switching on and off - this indicates that the charger isn't filtering the output very well, letting these spikes get into the connected device.
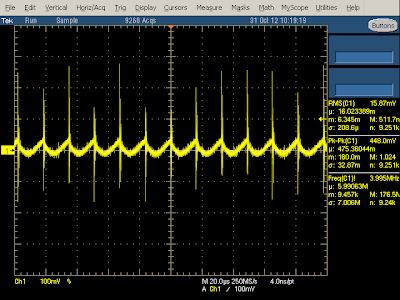
The diagram below zooms in to show the output in more detail. Each spike is when the switching transistor turns on at 60 kHz. The output power drops as the current through the flyback transformer increases (since the transformer secondary is blocked by the diode at this time). The output then climbs when the transistor switches off and the power is transferred to the secondary.
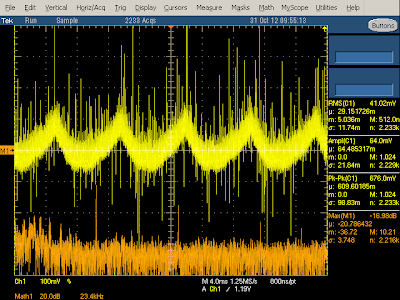
As the charger load increases above 3 amps, the quality of the output significantly decreases, and large 120 Hz ripple appears in the output (yellow). This is probably because the input capacitors can't store enough power to provide a constant output at this high load. Since the charger is only rated to provide 2.1 amps of output, I don't consider this a design flaw, but it's interesting to see this behavior in the output. The key result here is not to overload the charger, because the power quality gets much worse.
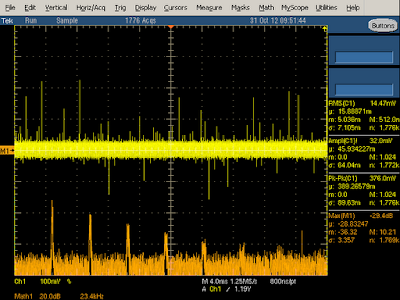
The charger is designed to reduce the switching frequency under low load for efficiency. I found this feature kicks in at loads under 1 amp, with the switching frequency smoothly dropping from 60 kHz to 29 kHz at 250 mA load and even lower under no load. The graph below shows the frequency spectrum at 250 mA load. Note that the spikes are wider than the previous case since the frequency becomes more unstable when it is reduced.
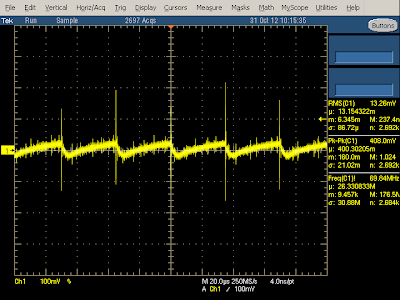
The output waveform below at 250 mA is similar to the previous (2A) case, except at a lower frequency. Note that the output still has large spikes when the transistor switches on. The output voltage drops while the switching transistor is on and then rises while the transistor is off (due to the flyback design), so you can see below that the transistor is off most of the time at low power.
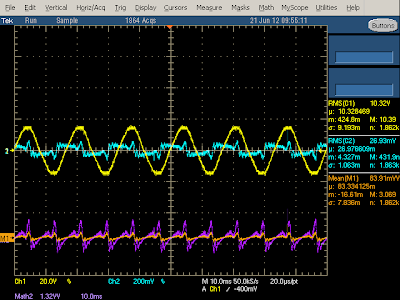
The oscilloscope output below shows the power usage of the charger under no load. The line input voltage (yellow) is a nice sine wave, but the current (cyan) is very irregular. There is a bump corresponding to the voltage peaks as the input diodes conduct and re-charge the filter capacitors. The remaining current oscillations are unusual - I haven't seen them in other chargers, and I expect they are due to the large input choke. From the orange line you can see that the power usage has small spikes at 120 Hz. Taking the power factor into account and computing real power shows the charger uses 180 mW when idle which is fairly high, but actually lower than the Apple iPhone charger.
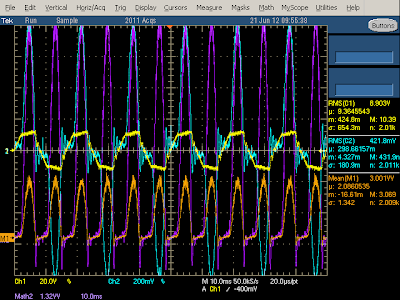
With load applied to the charger, the power usage shoots up as shown below. I compute the power usage as 6.4 watts, while the charger is supplying 4.4 watts to the output, for an efficiency of 69%. The shape of the current curve (cyan) and power curve (orange) shows that the charger is taking line power about half the time (the big curved peaks), and not for the other half (the flat oscillations in between). This illustrates the bad power factor that switching power supplies have. (PC power supplies often use power factor correction (PFC) circuits to improve the power factor.)The yellow input voltage curve is somewhat distorted, probably due to the lame isolation transformer I used.
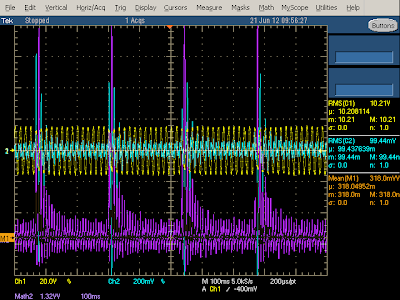
You might wonder what happens if you short-circuit the output of the charger. It is designed to shut down before damage occurs, rather than self-destruct. After the internal voltage drops, the charger will start up again, and repeat this cycle until the problem goes away. This is called "hiccup mode", since the charger generates hiccups of power. The oscilloscope trace below shows the power consumption of the KMS charger when shorted. Note the pulses as it start up and shuts down every 250 milliseconds.
Like most power supplies, the charger uses a TL431A for the voltage feedback.[1] This TL431A is produced by Wing Shing Computer Components The optocoupler is an ORPC 817B optocoupler from Shenzen Orient Technology Co., Ltd. (I don't want to speculate on the cultural significance of their raising the flag over Iwo Jima company logo.)
 ,
customer ratings for this charger are split between people who love it
and people who hate it, which seems reasonable given what I saw in the
teardown.
Thanks to Gary F. for providing the charger.

One puzzle about this charger is it's unclear who makes it and what model it is. The case says it's the KMS AC-09 but the circuit board says "TC09-new-V4.2". Amazon lists the brand as "Cosmos®", but I couldn't find any sign that KMS or Cosmos are actual companies. After some web searches, I think the charger is built by Guangzhou Panyu Qiaonan Saidi Electronic Factory (more) as the TC09 charger for $5.30 wholesale, or maybe HK Yingjia International, a consumer electronics manufacturer in Shenzhen (more). In any case, I'll call this the "KMS charger" since I need to call it something.
In my previous lab analysis of 12 chargers, I compared a dozen different chargers in 9 different categories, rating them from 1 to 5 'bolts' and the KMS charger came in about average in terms of performance. The results for the KMS charger are summarized below. For details on these measurements, see my previous article A dozen USB chargers in the lab).
| Overall rating | |
|---|---|
| Vampire (idle) power usage | |
| Efficiency under load | |
| Achieves power rating | |
| Spikes in output | |
| High-frequency noise in output | |
| Ripple in output | |
| Voltage sag | |
| Current sag | |
| Regulation quality |
The good and the bad
Overall, this charger is much higher quality than the $2 counterfeit chargers, but considerably lower quality than name-brand chargers. The charger provides more filtering than basic chargers, from the large input choke to the multiple output inductors. It includes X and Y capacitors for filtering.The charger looks mostly safe, although it doesn't have UL certification and I suspect it would fail certification. The 6mm clearance between the primary and secondary looks solid. However, the transformer windings are only separated by 3mm, rather than 6mm, as I show below. (This is still much superior to the $2 chargers that have almost no separation.)
One interesting feature of the power supply is the power plug can be interchanged for use in different countries. (Some other chargers such as the HP TouchPad and Apple iPad are similar.)

The charger has some quality issues. The power quality measurements I did in my previous article show the KMS charger has fairly poor quality output, with a lot of noise in the output.
The IC datasheet recommends 200 mm2 of foil on the IC output pins to provide cooling. I measured about 18 mm2 (less than 10% of recommended), which suggests the charger may overheat under full load.

The above photo shows that the build quality of the charger is not extremely high. The inductor at the front right is very crooked, and the optocoupler at the left is somewhat crooked. While this doesn't affect the performance, it shows the assembly was rapid rather than careful. More concerning, some of the solder joints appear to be almost bridged, which could cause catastrophic failure of the charger. I also found a government report of a KMS charger catching fire, apparently due to a loose wire in the power plug.
One unique feature of the charger is the blue LEDs which cause it to emit an eerie blue glow when in use. A lot of users dislike this though (according to reviews), because the light is distracting at night.

The circuit
 For readers interested in circuits, I have prepared the above
approximate schematic (click for a larger view). The circuit is pretty
straightforward compared to other chargers (look at my iPhone charger schematic
for comparison). Starting at the upper left, the input AC is converted
to DC by the diode bridge, and then filtered by a simple
inductor-capacitor filter. This high-voltage DC is connected to the
flyback transformer primary. The THX203H control IC switches the other
side of the flyback transformer to ground through the current-sense
resistors R12A and R12B and inductor L3. (Most chargers use a separate
switching transistor, but in this charger, the transistor is inside the
control IC.) The snubber circuit R2, C3, and D6 absorbs some of the
high-frequency switching spikes (although looking at the output below,
this circuit isn't entirely successful). The auxiliary transformer
winding and D7 and C4 provide the DC power to the control IC. The
optocoupler provides feedback to the IC, indicating the output voltage
level.
On the secondary side, the high-speed Schottky diodes (D5) convert the transformer output to DC. This is then filtered through an inductor-capacitor filter that smooths it out. The output voltage feedback is generated by the TL431A regulator and fed into the optocoupler.[1]
Finally, the actual USB output circuitry has more components than you'd expect. For each pair of ports, four resistors set the D+ and D- voltages to indicate to devices that the charger is (pretending to be) an Apple 2A charger. Each port has a small bypass capacitor to smooth out power transients. Finally there are two blue LEDs with current-limiting resistors to provide the blue glow.
The controller IC poses a bit of a mystery. It's labeled as the THX 203H controller, which turns out to be manufactured by NanJing TongHuaXin Electronic Co, Ltd., a Chinese switching power supply chip company (details). The datasheet for this part is very hard to understand, as it is machine-translated from Chinese, for example:
The startup circuit inside IC is designed as a particular current inhalation way, so it can start up with the magnification function of the power switch tube itself.After some more investigation, this chip seems to be the SDC603 Current Mode PWM Controller designed by SDC Semi (Shaoxing Devechip Microelectronics Co., Ltd.). This is a Chinese state-level R&D center that is part of China's Torch Plan Project to develop high-tech industries. (Also check out the SDC company song.) The controller chip is a basic 8-pin current-mode PWM controller chip. It includes a built-in NPN power transistor, which reduces the charger part count. The chip can produce 12 watts output power.
Circuit board
 The above picture shows the KMS charger circuit board on the left and a
circuit board from the HP TouchPad charger on the right.
Compact phone chargers such as the iPhone or TouchPad chargers go to
amazing effort to pack the components as tightly as possible. The KMS
charger on the other hand has a much more spacious design with a lot of
wasted space. Since any charger with 4 USB ports is going to be fairly
large, they probably figured it's not worth the effort to make the rest
of the circuitry compact. The difference in density between the two
circuit boards is striking, though.
A key safety feature of the KMS charger is visible in the middle of the circuit board - note the angular cut-out slot, and the empty vertical region with no circuitry. This isolates the high-voltage circuits on the right from the low-voltage output circuits on the left. The KMS charger has a safe 6mm gap and the cut-out provides additional creepage distance. Counterfeit chargers usually skip this critical safety feature, with only a millimeter or two keeping the high voltage from reaching the output and shocking the user.
You might wonder how the charger works if the high voltage and low voltage circuits are separated by a gap. The key is that any components that cross this gap must be specially designed to avoid electrical hazards. The key component is the flyback transformer, which transfers the power through magnetic fields, avoiding any direct electrical connection between the two sides. The feedback signal passes from the secondary to the primary through an optocoupler, which transmits the feedback through a light signal, again avoiding an electrical connection. Finally, a Y safety capacitor connects the primary and secondary grounds to reduce electrical noise. The design of a Y capacitor ensures it won't pass dangerous electrical currents, and won't short out even under fault conditions.
Transformer teardown
The flyback transformer is the key component of a charger and usually the largest and most expensive. The transformer is where the high input voltage is converted to the output voltage, and the two voltages are in extremely close proximity, so the safety of the transformer is critical. From the outside, you can't tell if the manufacturer saved a few cents by leaving out most of the insulation, as happens with $2 chargers. I tore apart the transformer of the KMS charger to see what's inside. The black circle on top of the transformer seen earlier is simply a foam disk, which helps reduce transformer noise by padding the transformer against the case. If a charger makes a high-pitched noise, it's usually coming from the transformer. Power supplies are usually designed with switching frequencies higher than people can hear, but in some circumstances it's still audible, especially if you are young and haven't lost high frequency hearing.
Under the first layers of insulating tape is a copper 'belly band' which surrounds the transformer to provide noise shielding from eddy currents in the transformer.[2] This copper shielding is omitted from super-cheap transformers, showing that this charger goes beyond the minimum.

The windings are all separated by insulating tape. Under the belly band and insulating tape is the auxiliary winding, which provides power to the control IC. You might wonder why the IC needs a separate power supply instead of using the USB power output, but this wouldn't be safe because the USB output would no longer be isolated from the input. This winding is 9 turns of wire; since the IC requires low current, the wire is fairly thin.

Above you can see half of the primary winding, which is fed by the input power. This winding has 40 turns of wire.
An interesting safety feature is the 3 mm "margin tape"[3] to the lower right of the winding, which ensures that the primary winding stays 3 mm away from the edge. I was interested to see this, since other transformers I've disassembled use triple-insulated wire instead of boundary tape. To ensure safe electrical isolation between the primary and secondary windings, either the secondary wires need to be triple-insulated, or there needs to be at least 6mm of distance between the windings. Super-small chargers don't have 3mm of extra room, so they use the more expensive triple-insulated wire. But since the KMS is larger, it uses the 3mm margin tape. I'm not an expert on safety requirements, but it looks like this transformer doesn't quite meet the requirements. Normally, the margin tape is put on both sides, so there's a total of 6mm creepage distance between the windings.[4][5] But since the tape is only on one side, the windings only have half of the required distance.

The secondary winding provides the low-voltage high-current output with 8 turns of wire. In order to support 2 amps, this winding has thick wire with four strands in parallel. I haven't seen parallel strands like this before, probably because the KMS charger supplies higher power. Note the 3mm margin tape keeping the winding away from the edge.

Finally, the second half of the primary winding forms the innermost layer of the transformer; this is also 40 turns of wire. The primary winding is split into two layers that surround the secondary winding for better electrical properties. Note that the primary winding is 80 turns, while the secondary output winding is 8 turns. To oversimplify a bit, this means the output will be 10 times the current of the input at 1/10 the voltage, which is how the high voltage low current input results in the low voltage high current output. The above picture gives a good view of the 3mm margin tape at the right that keeps the wire away from the edge of the core.
Measuring the charger in use
The charger is a switching power supply using a flyback transformer. How this works is the high voltage DC is switched on and off tens of thousands of times a second by the control IC. These pulses of DC are sent into the flyback transformer. A flyback transformer is different from normal transformers in that the output diode blocks power from flowing out of the transformer while power is flowing in. Instead, as the current increases, power is stored in the transformer as a magnetic field. When the input current switches off, the stored power then flows out of the transformer, providing the desired output.By looking at the output voltage and frequency spectrum, we can determine a fair bit about how the device operates. I measured a constant 60 kHz switching frequency above 1 amp output load, but a dropping frequency for lower loads. The datasheet gives some clues to this behavior. The power supply normally operates using PWM (pulse width modulation). The switching frequency is constant, but the amount of time the power transistor is on varies. The longer it is on, the more power into the transformer and the more output power. This matches the observed behavior from 1 amp to 3.5 amps. The datasheet also describes how the switching frequency drops under low power, which matches what I observed below 1 amp.

The above oscilloscope trace illustrates the behavior when producing 2 amps. The frequency spectrum shows narrow peaks (orange) at the 60 kHz switching frequency and harmonics. The yellow output voltage shows a bunch of large spikes due to the power switching on and off - this indicates that the charger isn't filtering the output very well, letting these spikes get into the connected device.
The diagram below zooms in to show the output in more detail. Each spike is when the switching transistor turns on at 60 kHz. The output power drops as the current through the flyback transformer increases (since the transformer secondary is blocked by the diode at this time). The output then climbs when the transistor switches off and the power is transferred to the secondary.

As the charger load increases above 3 amps, the quality of the output significantly decreases, and large 120 Hz ripple appears in the output (yellow). This is probably because the input capacitors can't store enough power to provide a constant output at this high load. Since the charger is only rated to provide 2.1 amps of output, I don't consider this a design flaw, but it's interesting to see this behavior in the output. The key result here is not to overload the charger, because the power quality gets much worse.

The charger is designed to reduce the switching frequency under low load for efficiency. I found this feature kicks in at loads under 1 amp, with the switching frequency smoothly dropping from 60 kHz to 29 kHz at 250 mA load and even lower under no load. The graph below shows the frequency spectrum at 250 mA load. Note that the spikes are wider than the previous case since the frequency becomes more unstable when it is reduced.

The output waveform below at 250 mA is similar to the previous (2A) case, except at a lower frequency. Note that the output still has large spikes when the transistor switches on. The output voltage drops while the switching transistor is on and then rises while the transistor is off (due to the flyback design), so you can see below that the transistor is off most of the time at low power.

Power consumption
Measuring the power consumption of a charger is tricky because the charger doesn't use power like a normal resistive load, but uses a nonlinear part of the input current. This results in a power factor lower than unity. (You might expect that the poor power factor is because the charger switches on and off thousands of times a second, but actually it's the fault of the diode bridge.) I measured the power consumption of the charger under load by measuring the instantaneous line voltage and current, computing the instantaneous power, and then computing the real power from this.[6] In the following diagrams, the input line voltage is shown in yellow, and the input current is in cyan. The instantaneous power is graphed in orange at the bottom - simply the product of the voltage and current.[7]The oscilloscope output below shows the power usage of the charger under no load. The line input voltage (yellow) is a nice sine wave, but the current (cyan) is very irregular. There is a bump corresponding to the voltage peaks as the input diodes conduct and re-charge the filter capacitors. The remaining current oscillations are unusual - I haven't seen them in other chargers, and I expect they are due to the large input choke. From the orange line you can see that the power usage has small spikes at 120 Hz. Taking the power factor into account and computing real power shows the charger uses 180 mW when idle which is fairly high, but actually lower than the Apple iPhone charger.

With load applied to the charger, the power usage shoots up as shown below. I compute the power usage as 6.4 watts, while the charger is supplying 4.4 watts to the output, for an efficiency of 69%. The shape of the current curve (cyan) and power curve (orange) shows that the charger is taking line power about half the time (the big curved peaks), and not for the other half (the flat oscillations in between). This illustrates the bad power factor that switching power supplies have. (PC power supplies often use power factor correction (PFC) circuits to improve the power factor.)The yellow input voltage curve is somewhat distorted, probably due to the lame isolation transformer I used.

You might wonder what happens if you short-circuit the output of the charger. It is designed to shut down before damage occurs, rather than self-destruct. After the internal voltage drops, the charger will start up again, and repeat this cycle until the problem goes away. This is called "hiccup mode", since the charger generates hiccups of power. The oscilloscope trace below shows the power consumption of the KMS charger when shorted. Note the pulses as it start up and shuts down every 250 milliseconds.

Components
For those who are interested in the components, I have some details. The two 6.8uF 400V electrolytic capacitors in the primary are made by ChengX. The two 470uF capacitors in the secondary are made by JWCO. The X capacitor is a .1uF K 275V X2 made by Dain Electronics, a Chinese manufacturer of plastic metal film capacitors, now merged with WINDAY Electronic Industrial Co Ltd. The Y1 capacitor is a JN222M 2200pF disk ceramic suppression capacitor manufactured by Jya-Nay, a Taiwanese capacitor company. There's also a blue 681J (i.e. .68nF) polyester film capacitor of unknown manufacturer; looking at the circuit board this capacitor (C7) was originally a surface-mounted device, but was replaced with a larger capacitor. The diodes are manufactured by MIC (Master Instrument Corporation, Shanghai). Most chargers use a diode bridge to convert the AC to DC, but this charger uses four independent diodes, which are 1N4007 700V diodes. The secondary rectification uses two Schottky diodes (SR360 3 amp 60V) from MIC. The circuit board uses the unusual mounting of two diodes on top of each other soldered into the same holes. The charger also uses FR107 700V fast recovery diodes.Like most power supplies, the charger uses a TL431A for the voltage feedback.[1] This TL431A is produced by Wing Shing Computer Components The optocoupler is an ORPC 817B optocoupler from Shenzen Orient Technology Co., Ltd. (I don't want to speculate on the cultural significance of their raising the flag over Iwo Jima company logo.)
Conclusion
The KMS charger occupies an interesting middle ground between dangerous $2 counterfeit chargers and expensive name-brand chargers. Tearing down this 4-port USB charger of unknown origin reveals details of the circuitry. It also illustrates a network of Chinese suppliers and manufacturers, most of which are hardly known in the US. On Amazon
Subscribe to:
Comments
(
Atom
)
